Can you find the river plume in the data?
This section is quite technical. So if you don’t want to trouble the grey cells too much, maybe go to another section.
I spent 25 years measuring the water turbidity (basically how muddy or cloudy the water is). We invented the instruments for doing this over long periods.[i] We mostly measured the turbidity on inshore reefs, and in all that time it was almost impossible to “see” the impact on rivers because the waves, caused by wind, stir up the sea bed and have far more impact on how much mud is in the water than river plumes.
So let’s see some real data to demonstrate te point. You will be asked some questions.
Example A
In the top picture below (Figure 1), you can clearly see the river plume in the satellite photo on the reefs of Horshoe Bay on Magnetic Island. There is also a turbid plume seen in the lower picture, but this was in the dry season (no river flow).
The data of turbidity at Horshoe Bay is shown in Figure 2 taken over a period of about 18 months and covers the period when both the pictures in Figure 1 were taken. You will see there are many periods when the turbidity was high – but there was only one flood. So here are the questions.
- What time marked on the data graph (figure 2) was the top satellite picture in Figure 1 taken. A, B, C or D?
- What time marked on the data graph was the lower satellite picture taken. A, B, C, or D?
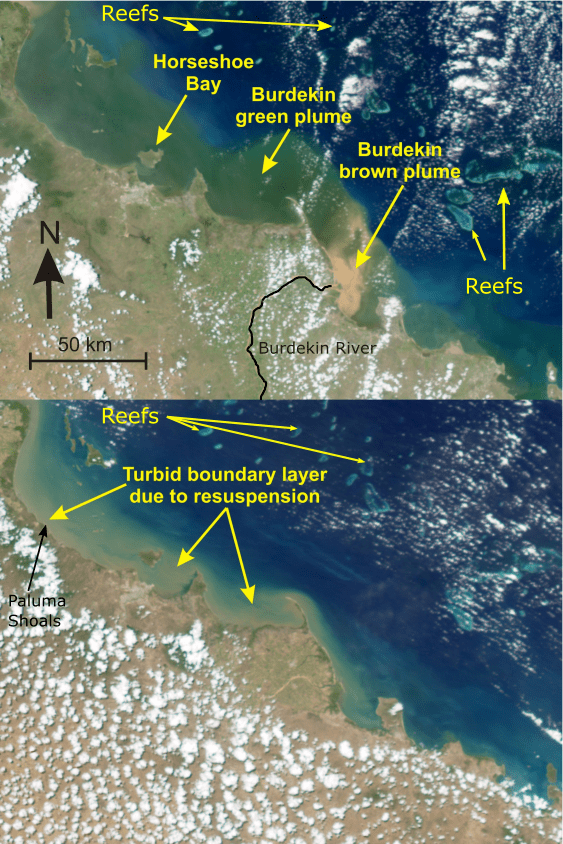
Figure 1
Top. Satellite image of a river plume from the Burdekin River during a flood (see Orpin and Ridd, 2012 and Cooper et al 2008). Picture taken on 10 February 2007
Bottom Satellite image 12 October 2006. This image, taken during a strong wind event during the dry season, clearly shows the turbid coastal boundary region which extends beyond Magnetic Island.

Figure 2: Water turbidity, light on the seabed, and windspeed for Horseshoe Bay. From Cooper et al. (2008)
Answer
- The flood was at the time marked C. But as we will see in the next example, most of this peak is not due to the flood, but rather it is the high wind that came with the flood.
Notice that when the wind gets above about 7.5 m/s (roughly 30 km/hr or 15 knots) the water turbidity goes up, and the amount of light reaching the coral goes down.
At time A, a cyclone crossed the coast 150 km to the north of Horseshoe Bay. The waves generated by the cyclone reached Horseshoe Bay raising the turbidity. There was no flood at B or D but there were strong South Easterly Trade winds at those times. There are many peaks of turbidity in this data corresponding to periods of strong winds.
- The lower satellite picture was at taken at time B – in the dry season (12th October). Conditions similar to this occur extremely regularly.
Example B
Let’s now have a very close look at the turbidity peak at time C which is around the time the flood occurred. Remember floods are caused by major weather events often lasting a week or more. Heavy rain is often associated with strong winds, and strong winds make waves, which stir up the seabed causing high water turbidity. So the strong wind can cause both floods and high turbidity – but it is not necessarily true that high turbidity is caused by the floods.
Three questions from figure 3 below.
- When did the river level start to rise? X, Y or Z?
- When was the picture of the flood in Figure 1 (upper) taken? X, Y or Z?
- When did the peak of the flood occur? X, Y or Z?
The answers are
- X. (see figure 4). The flood had only just begun at the time when the turbidity already reached its initial peak. The turbidity had been rising for two days prior to the flood because the wind was getting stronger (figure 4)
- Z. The picture was taken after the water turbidity had returned to very low levels and when the wind had dropped below 7.5 m/s. The water in the picture still looks discoloured mostly due to phytoplankton in the water. There was very little sediment or mud in the water. But the water would have been heavily muddy brown a couple of days earlier when the wind was strong. But there is almost always heavy cloud when the wind is strong and satellite/aerial pictures are not possible to take.
- Y. The flood peak (figure 4) did not occur until four days after the period of high turbidity started. The flood level slowly dropped, but even by time Z, there was still a huge flow in the river – but very low turbidity.
Conclusion: The flood water had only a very minor effect on water turbidity at Horseshoe Bay. The wind caused high waves which caused high turbidity. The turbidity rose well before the flood, and the turbidity fell well before the flood finished.
And this is for a fringing reef close to shore. For the GBR – far offshore – there was totally negligible impact from the flood.

Figure 3: Turbidity and wind speed around the time of the picture taken in Figure 3.

Figure 4: Water turbidity and Burdekin River water level at Inkerman Bridge. At water levels less than about 1.3 m, the Burdekin River has effectively stopped flowing.
[i] Ridd, P. V., and Larcombe, P. (1994). Biofouling control for optical
backscatter suspended sediment sensors. Marine Geology 116, 255–258.
doi:10.1016/0025-3227(94)90044-2
